
Welcome back business owners, marketing professionals, and anyone interested in harnessing digital analytics for business growth!
In the first part of this series, we discussed:
- The importance of digital analytics for online businesses.
- How Google Analytics 4 collects and processes data.
- The basic structure of a GA4 account, and
- The role of dimensions and metrics in GA4.
Catch up here: Google Analytics 4 (GA4) for Beginners—Part 1: Data Collection, Processing, and Account Structure
In this part, we’ll:
- Take a closer look at the GA4 user interface.
- Learn the reports available in analytics and how to gain insights from them.
Ready? Let’s get started!
Understanding the Google Analytics 4 User Interface
When you log into your GA4 account, the first thing you see is your Home Page. This contains a snapshot of insights relevant to your business. Suppose you have already played around with the tool. In that case, you will also see recently accessed reports and content suggestions that become more personalized as you continue to use Google Analytics.
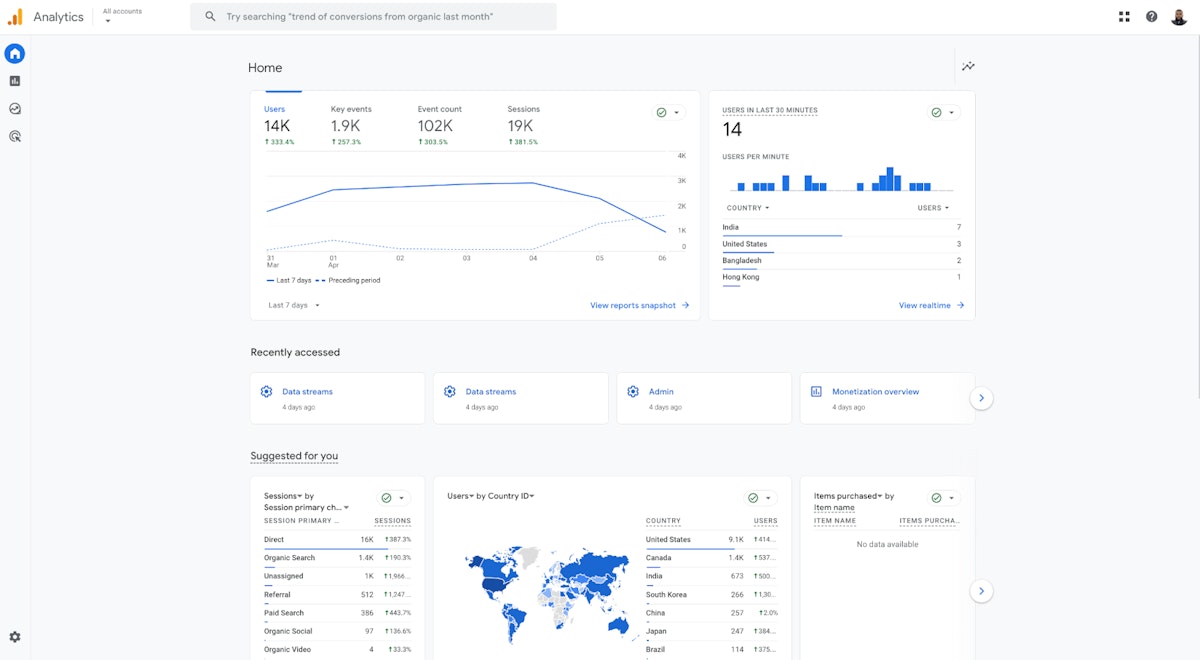
GA4 home page
If the dimensions and metrics in the image above seem confusing, don’t worry; they’ll become much less so as we proceed.
To the left of the homepage, you’ll find a navigation bar with 4 icons in addition to the Home Page:
- Reports
- Explore
- Advertising, &
- Admin
Let’s take a quick peek at these sections.
The GA4 Reports Page
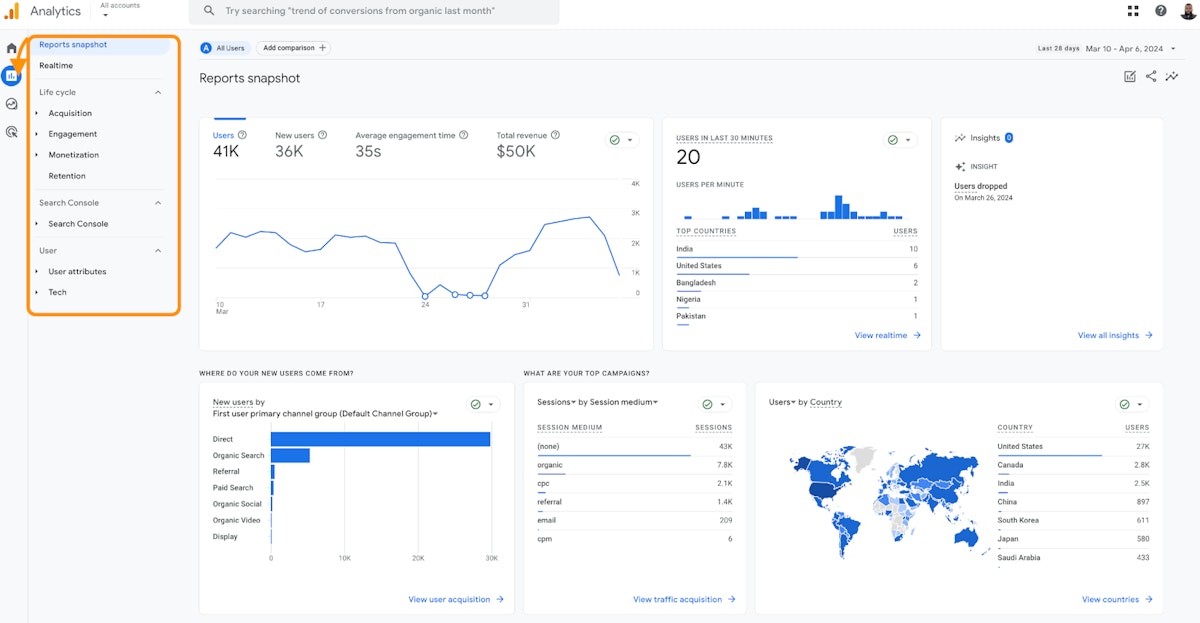
GA4 Reports Page
The Reports page contains…Reports!

Seriously, though, reports help you understand user activity data on your website and apps. The orange rectangle in the image above encases general and more specific ready-made reports about how your users behave, from the moment they encounter your website or app and engage with it till they navigate away from it. \
The GA4 Explore Page
The Explore page offers more sophisticated approaches for analyzing data with powerful audience discovery and comparison tools.
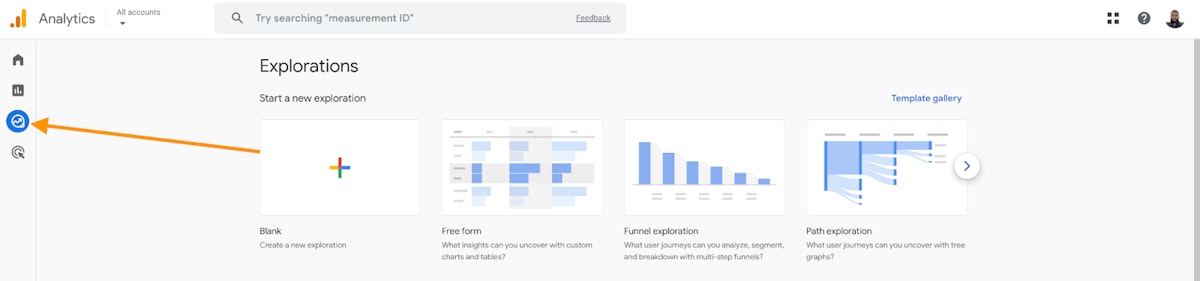
GA4 Explore Page
At the top of your Explore page, you will find a template gallery containing select data visualization techniques such as:
- Free form
- Funnel exploration
- Path exploration
- Segment overlap
- Cohort exploration, &
- User lifetime
These can be applied to your business for deeper insights into user behavior on your website or app.
The GA4 Advertising Page
This section helps you understand the ROI of your marketing spend and advertising efforts across channels.
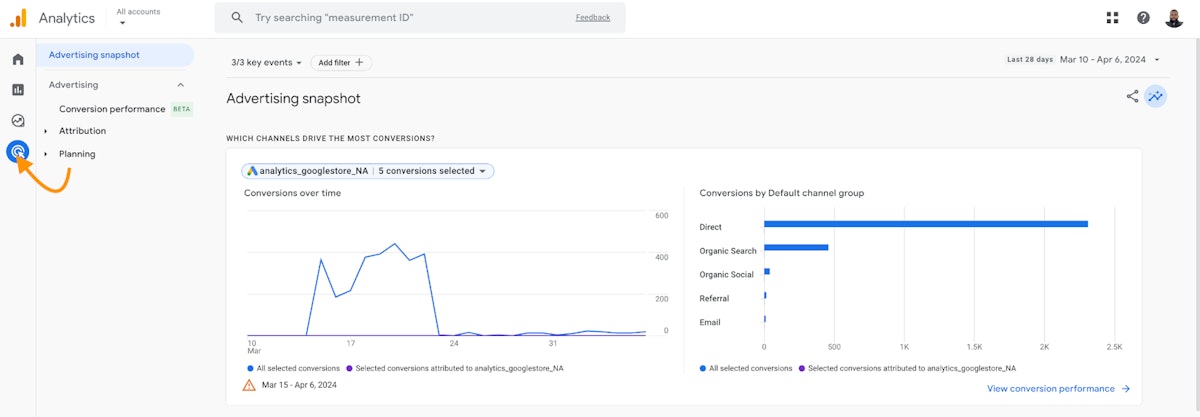
GA4 Advertising Page
The GA4 Admin Page
The admin section allows you to manage Google accounts, properties, events, and data streams. You can customize events, dimensions & metrics and manage who can access your data.
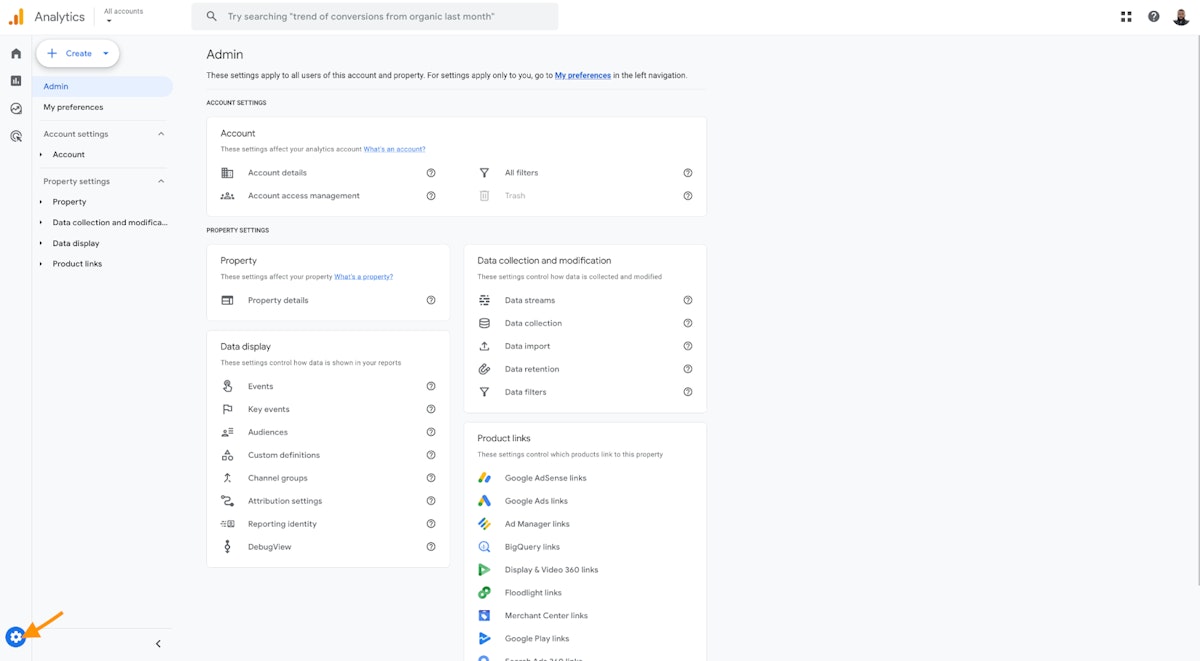
GA4 Admin Page
\At the Top of your GA4 screen, you’ll find the account and property toggle; which lets you easily switch between all your properties, and a search bar.
Using the GA4 Search Bar
The search bar in GA4 is one of my favorite parts of the entire tool because it has many useful features – reports, educational materials, and, best of all, specific insights about user interaction/engagement.
Suppose I want to find out how many users have visited HackerNoon from Nigeria in the last month. I can ask that question directly in the search bar.
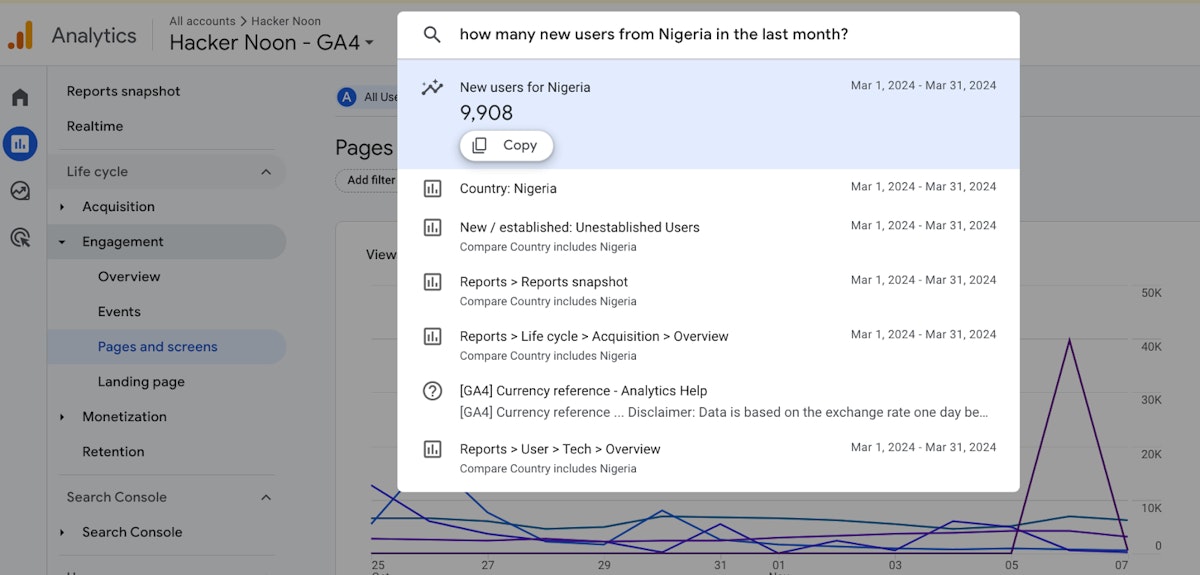
GA4 search query result
Voila!
A detailed response will appear in the right-hand panel of your GA4 screen.
Suppose, instead, I forgot how to switch accounts or properties in GA4. I can ask as well.
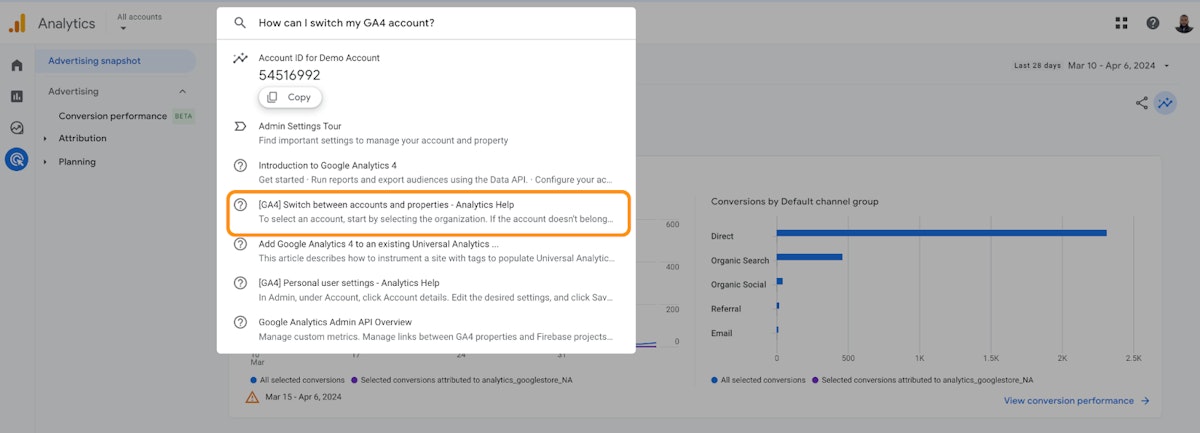
GA4 search query result
Continue exploring the search bar to discover more business-related questions you can answer.
Now that we’re done skimming through the Google Analytics 4 user interface, let’s dive a little deeper into how reports are put together!
Understanding Reports in Google Analytics 4
Reports allow you to investigate your data, monitor traffic, and understand user activity. Once you’re on the reports page in GA4, you’ll first see your data as ‘Realtime Reports.’ This displays a quick view of traffic coming to your site and/or app over the past 30 minutes. After that, your data is processed into more detailed reports.
The Reports navigation menu can be broadly grouped into 2 default collections:
- Life cycle – contains info about acquisition, monetization, and onsite behavior.
- User – contains reports about the tech that users access your website and/or app with, as well as their geographical information.
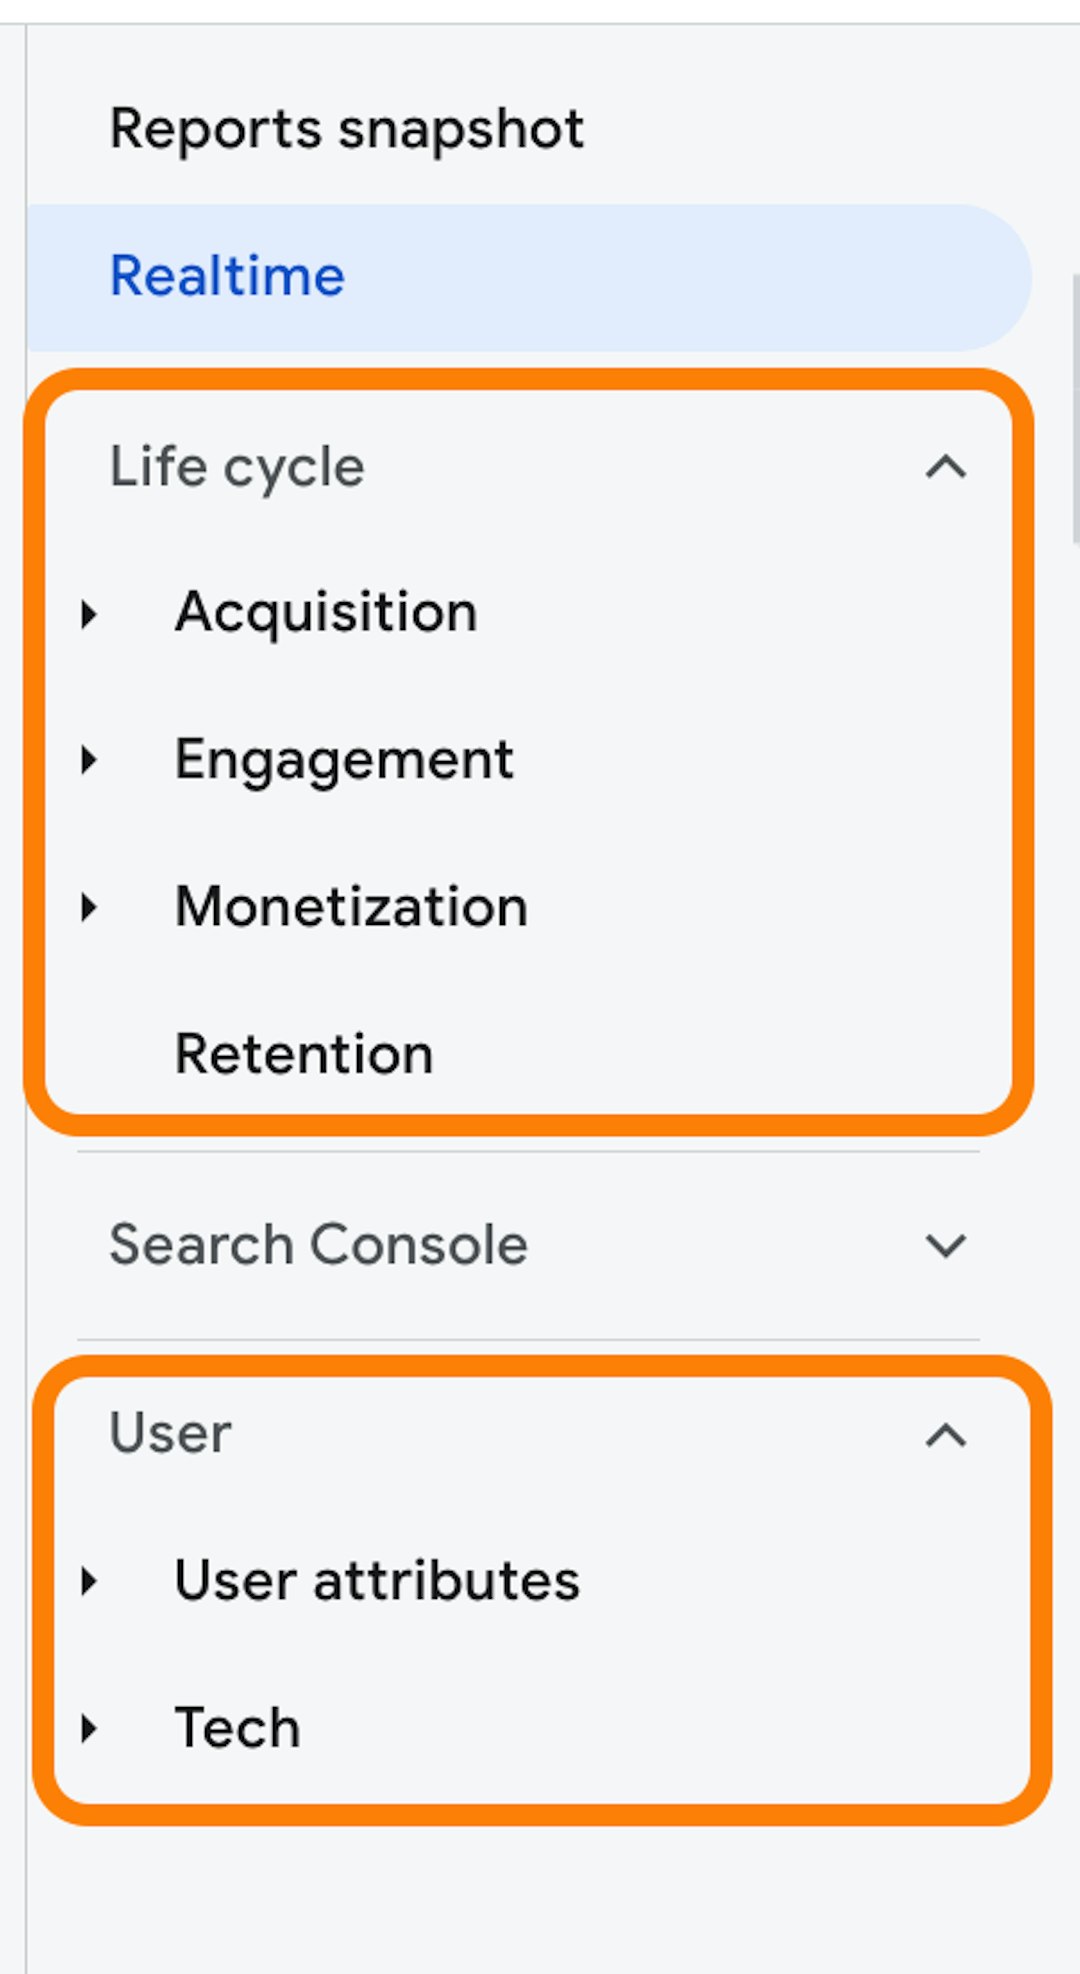
GA4 Reports Navigation Menu
Note: the default reports available to you depend on some of the information you provided during setup. Not to worry; you can always tweak this in admin.
There are two main types of reports in GA4:
- Overview Reports – These summarize information about a specific topic into cards with different objectives.
- Detailed Reports – This zooms in on 1 or 2 dimensions and shows you a more detailed view of your data.
Let’s explore this further with Acquisition reports.
GA4 Acquisition Reports
Once you click on Acquisition, you’ll see a list of available reports underneath, the first being Acquisition Overview.
In this report, you’ll see cards that display intuitive summaries of your user and traffic acquisition data.
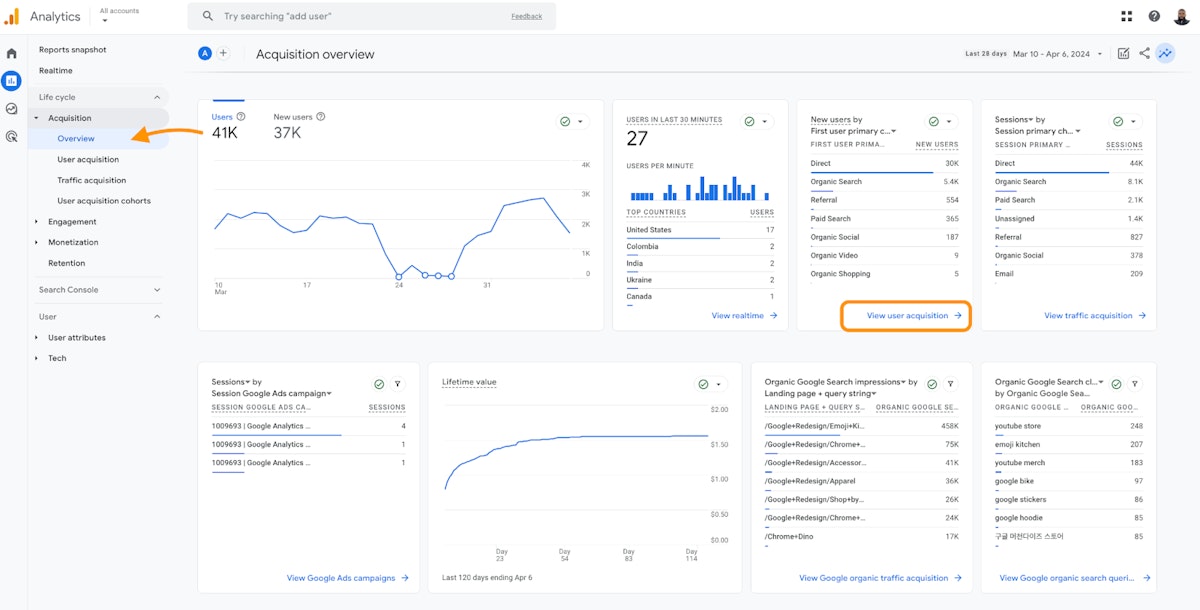
GA4 Acquisition Overview Report
\At the bottom of each card, you’ll find a clickable link that takes you deeper into the insights that the card summarizes. Clicking on this will load a new page with more information on the dataset.
Next, let’s look at the User Acquisition report.
GA4 User Acquisition Report
This report offers insights into how users find your website or app for the first time.
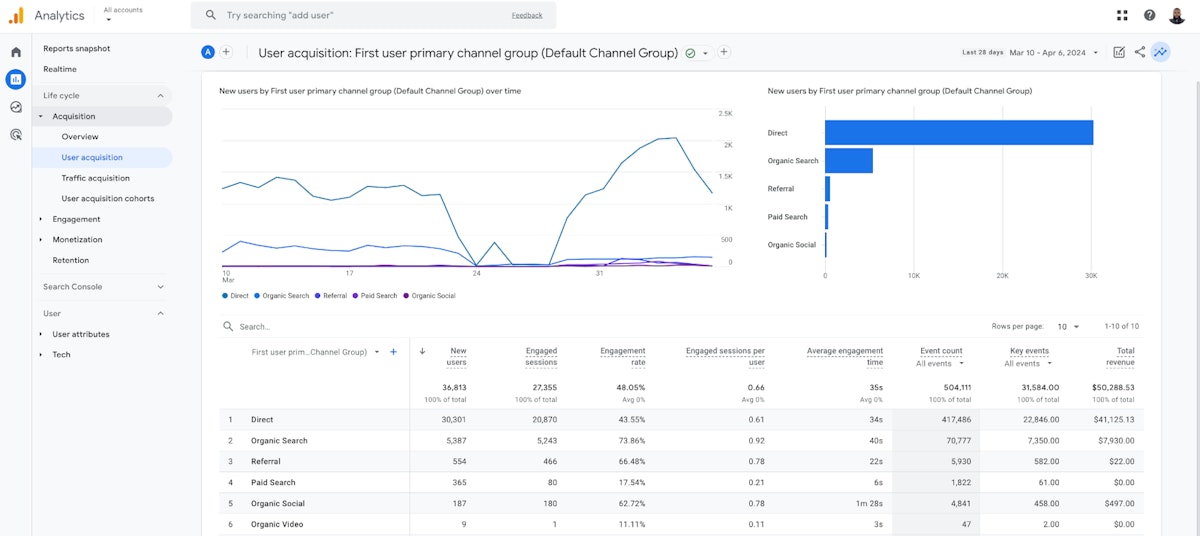
GA4 User Acquisition Report
By default, the user acquisition report will have ‘First Channel’ as its primary dimension.
\At the top of the table, you can see a dimension/metric toggle that lets you change your primary dimension depending on your unique business needs.
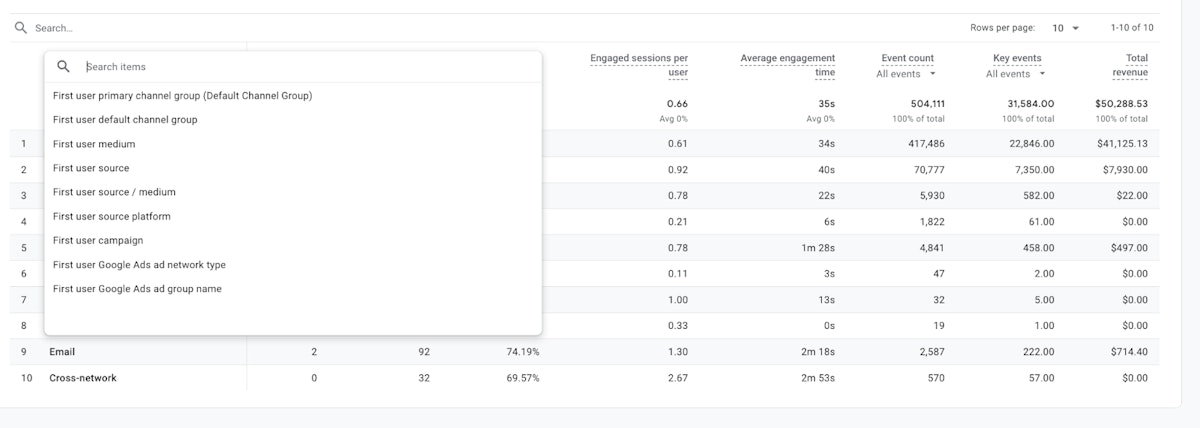
GA4 User Acquisition Report
Each dimension contains the text “First User” to demonstrate that the data is collected from when the user initially found your website.
Suppose you want to know how old your users are, their genders, or what countries they find your website from. You can learn all these and more by adding a secondary dimension.
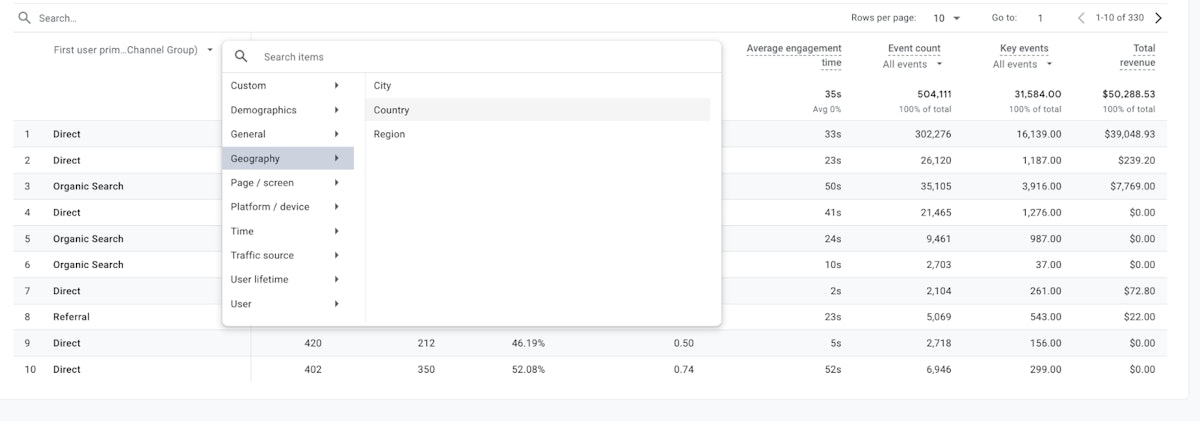
GA4 User Acquisition Report
Once you select a secondary dimension, a new column is added to the table like so:
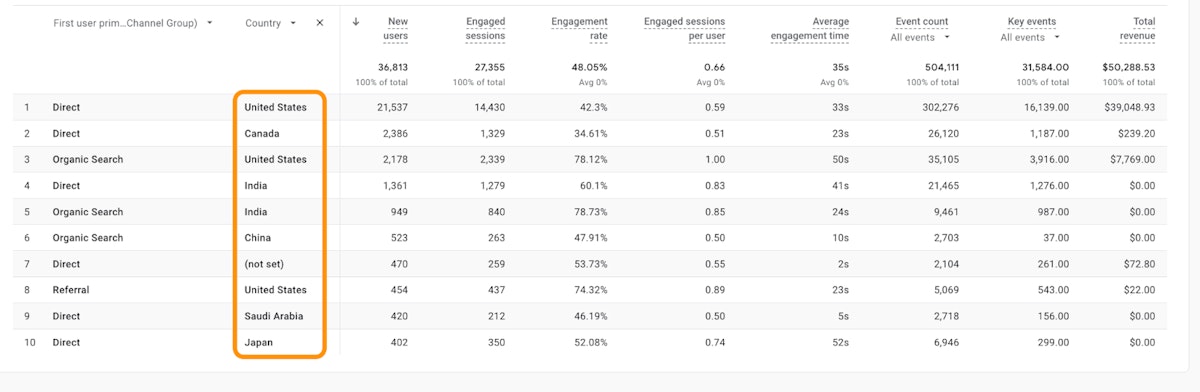
GA4 User Acquisition Report
Let’s get some useful information from this table.
Taking Row 3 with the First User, Country, and New Users columns, we can see that the sample site has gotten 2178 new users from organic search in the United States over the selected date range.

Next, let’s look at the traffic acquisition report.
GA4 Traffic Acquisition Report
This report is self-explanatory. It displays information on how traffic reaches your website or app.
In this report, each dimension contains “Sessions,” a session that groups user interactions based on when they engaged with your website or app.
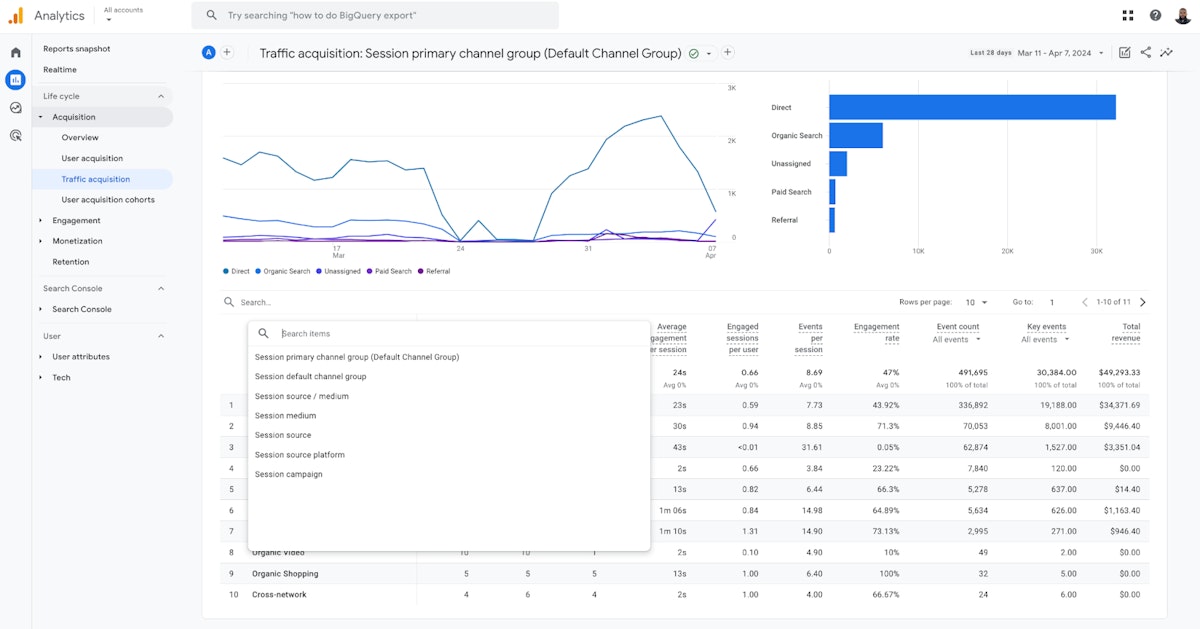
GA4 Traffic Acquisition Report
For instance, a web session starts when a user opens their browser and navigates to your website. It ends when a user closes the browser tab on your website.
The traffic acquisition report is concerned with where new sessions come from regardless of whether the user is new or returning. This is unlike the user acquisition report, which focuses on only the first session from a user and nothing else beyond that.
You can toggle your primary and secondary dimensions in the Traffic acquisition report the same way you did in the User acquisition report.
This article was originally published by Asher on HackerNoon.


