

If you run a business that uses a website or mobile app as a core component of service delivery, then you most likely want to know:
- How people find your website or app
- How these people interact with your website or app
- How effective your marketing strategy is
- The content on your website that achieves business goals best
Information like this can be obtained and understood thanks to Digital Analytics.
Simply put, digital analytics involves collecting, analyzing, and reporting on interaction data generated by users on your website or mobile application.
While many free & paid analytics tools are available, with 14M+ websites connected, at the time of writing, Google Analytics 4 is widely considered the market leader. That’s why, in this series of articles, it’ll be our focal point for understanding how digital analytics supports business needs.
What is Google Analytics 4(GA4)?
- “An analytics service that lets you measure traffic and engagement across your website and apps” – GA.
- Google’s “next-generation” measurement solution — the Jackson Storm to Universal Analytics’ Lightning Mcqueen.

Jackson Storm passing Lighnight Mcqueen
If you haven’t seen (or don’t care for) Disney Pixar’s Cars franchise, here’s a less obscure explanation/background:
From Universal Analytics to GA4
- Google has provided a digital analytics solution since November 2005, after acquiring Urchin—a standalone web analytics software that the Search god integrated into its suite of tools. Since then, the alphabet-owned mammoth evolved in step with a changing market.
- Progressive iterations resulted in Universal Analytics in 2012 which was built and optimized to service online measurements “anchored in the desktop web, independent sessions and more easily observable data from cookies”.
- On March 16, 2022, Google Analytics announced that it would be sunsetting Universal Analytics.
- GA4, the new generation of analytics enters the spotlight – armed with features that help businesses “understand complex multiplatform journeys” while keeping privacy front of mind.
With the background out of the way, let’s focus in on GA4.
How Does Google Analytics 4 Collect & Process Your Data?
Before data can be collected from your website or app, it needs to be connected to Google Analytics.
To connect your website to GA you need to add a tag to your site. A tag is a small piece of Javascript code added to each page of your website to measure user activity. Tags can be added directly to your website’s code, or with a tag management system like Google tag manager.
To connect your mobile app to GA you need to add the Firebase Software Development Kit to your app. When added, the Firebase SDK will collect and send data to GA just like the tag did for websites.
Once the GA tag has been added to your website and/or app it collects user interactions and sends them over to GA4 as events, many of which are automatically collected by GA when you connect your website or app.
Google Analytics collects the following information through the default implementation:
- Number of users
- Session statistics
- Approximate geolocation
- Browser and device information
As you connect your website or app with GA4, it’s important to clearly define your business objectives and understand the metrics that align with them. For instance, a technology publishing company like HackerNoonwould be interested in different metrics, insights, and reports than an Ecommerce company like Fashionova. Where HackerNoon would want a handle on information like page views, time on page & CTAs clicked, Fashionova would be more interested in info like best-performing items, countries that make the most purchases, and so forth.
At this juncture, It’s important to crystalize your business objectives and target metrics so you don’t go into analytics blind and collect “useless” information.
For context, where HackerNoon’s business objective would be to increase awareness, Fashionova’s would be to increase sales. And this informs the kinds of reports and insights valuable to either business.
For more detailed info on setting up your account and connecting it to Google Analytics 4, take a few minutes to watch the following video:
Next, let’s take a look at the basic structure of a GA4 account.
How to Structure a GA4 Account
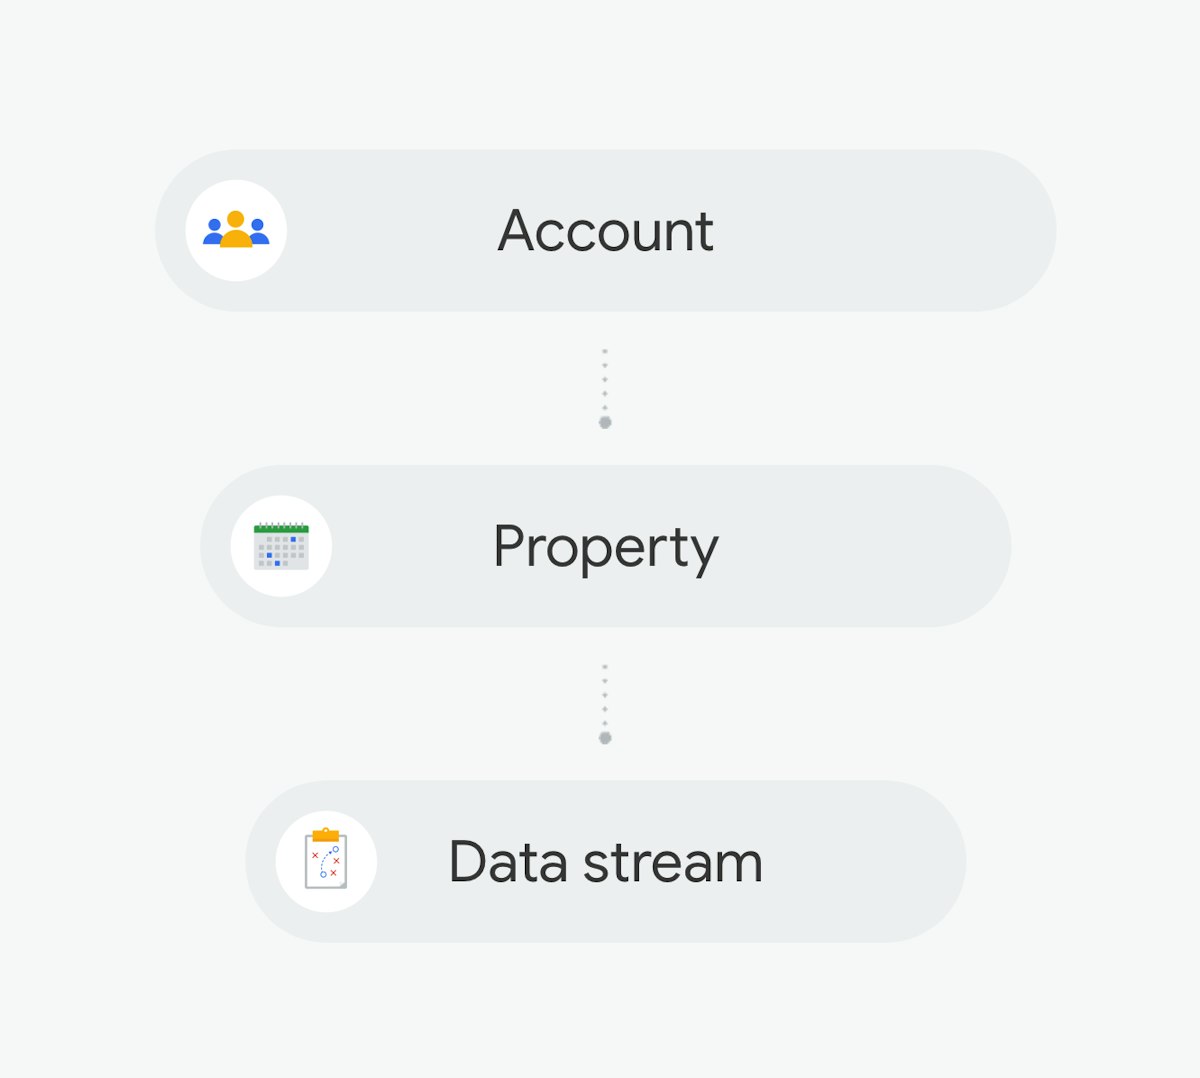
A Google Analytics 4 account is structured in 3 levels:
- The account itself
- Properties
- Data Streams
Here’s how Google Analytics defines these levels:
- Account – a collection of properties whose data is owned by a single business entity.
- Property – a grouping of user data from a website or an app.
- Data stream – represents the flow of data from a website or an app to the property. Web data streams are to websites as App data streams are to mobile applications.
source: https://skillshop.exceedlms.com/uploads/resource_courses/targets/1760943/original/index.html?_courseId=997997#/page/650454326793a69ddbf85597
If a company has both a website and a mobile app, the company would need 3 data streams – 1 for the website, 1 for the Android app, and 1 for the iOS app. This is considered best practice; mapping a user journey to a single data stream to ensure consistency in user & session reporting. As a rule of thumb, aiming for 1 account per company & 1 property per brand or business unit is ideal.
Let’s take a look at a made-up company called Orange Banana (OB for short)—a logistics company that serves two distinct clients, delivery drivers and customers. OB has two different websites for each kind of user.
Their analytics account would look like this:
- 1 account
- 2 properties (1 for customers. 1 for delivery drivers)
- 2 data streams (1 for each property)
After a successful first few months, OB experienced increased demand and decided to launch mobile apps for their customer user base available on Android and iOS. Delivery drivers, however, still had to rely on the website.
In this scenario, the analytics account would look like this:
- 1 account
- 2 properties
- 4 data streams [3 data streams (1 for web, 1 for Android app & 1 for iOS app), under the customer property. 1 data stream under the delivery drivers’ property]
GA4 Dimensions and Metrics
Once your account is connected and set up in tune with your business structure, Google starts collecting events and parameters that give the event more context.
Event parameters allow you to dissect user behavior with a high level of granularity. For instance, say a HackerNoon story catches a reader’s eye and they click on a story, once the page is opened Google Analytics records this interaction as an event with the name page_view. This event is collected with event parameters such as the name of the page/article being read, and how long the user stayed on the page/read the article. As I shared earlier, in addition to event and event parameters other user data like approximate geolocation and browser or device information are collected. These are collectively referred to as user properties.
Google uses events, event parameters & user properties to aggregate data into valuable reports.
To communicate this data as reports, Google Analytics uses dimensions and metrics.
A dimension, usually text instead of figures, is an attribute of your data that describes it. Metrics on the other hand are quantitative measures of your data. An example of a dimension is the name of an event. From our example, the dimension would be “page_view”. The metric would be the number of page views over a selected period.
Summarily, dimensions answer “what, who, or where?” questions, while metrics answer “how many?” questions.
Where are my top users from? — Dimension (country)
How many users visit my website from each country? — Metric
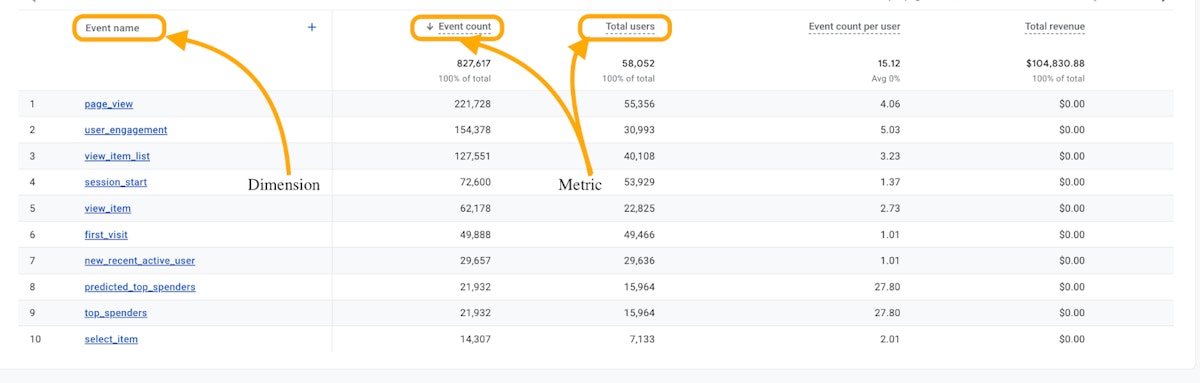
Source: Google Analytics Demo Property — Google Merchandise store (web data)
That’s it for this post!
So far, we’ve learned:
- The importance of digital analytics for online businesses.
- The evolution of Google Analytics from Universal Analytics to Google Analytics 4 (GA4)
- How Google Analytics 4 collects and processes data.
- The basic structure of a GA4 account, and
- The role of dimensions and metrics in GA4.
In the next post, we’ll spend some more time navigating through the GA4 user interface, understand the available reports and insights, and learn how to generate/gain business-specific insights from your reports.
See you soon!
This article was originally published by Asher on HackerNoon.


